
To our partners in global commerce,
In a global logistics landscape defined by volatility, intuition is no longer a viable defense. At Pacific Insight Labs, we operate on a fundamental premise: every supply chain disruption leaves a data trail long before the crisis occurs. Our risk methodology is designed to find those signals within the noise of transpacific trade and Southeast Asian distribution networks.
We do not offer generic broad-stroke predictions. Instead, we apply a rigorous analytical framework that treats supply chain vulnerabilities as structural weaknesses that can be mapped, measured, and mitigated. By synthesizing logistics data with geopolitical intelligence and local infrastructure constraints, we provide the clarity required to protect regional interests.
The Analytics Team
Pacific Insight Labs, Bangkok
Mapping the Architecture of Vulnerability
Latent Infrastructure Stress
We evaluate port capacities and regional road networks in Thailand and neighboring territories to identify bottlenecks that fail under peak load or adverse weather windows.
Predictive Signal Analysis
Utilizing live supply chain feeds, we detect micro-variations in transit times that often precede larger systemic failures in the logistics chain.
Geospatial Risk Layering
Our methodology overlays traditional logistics data with regional sociopolitical developments, providing a 360-degree view of potential human-centric disruptions.
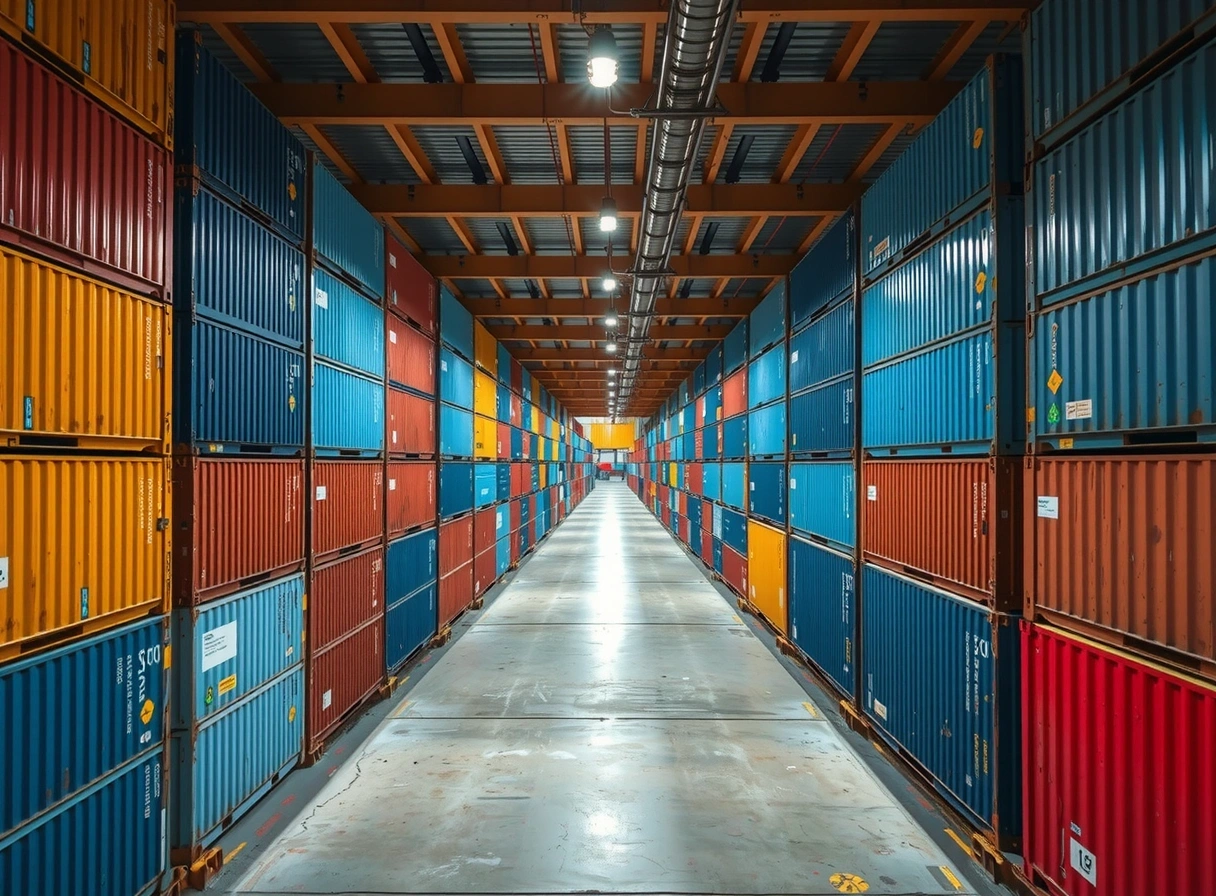
Technical Insight 001
Visualizing data flow across transshipment hubs allows for early detection of systemic friction points.
Quantifying Global Uncertainty
Our risk methodology leverages four distinct quadrants of data to build a comprehensive risk analytics profile for every client engagement.
Regulatory Fluidity
Monitoring trade policy shifts across ASEAN markets to prevent compliance-related cargo impounds and documentation bottlenecks.
CATEGORY_01Capacity Volatility
Analyzing real-time space availability versus carrier schedules to identify high-risk routes during seasonal surges.
CATEGORY_02Tier-N Visibility
Deep mapping of secondary and tertiary supplier networks to identify hidden dependencies that often cause total supply chain collapse.
CATEGORY_03Climatic Resilience
Integrating hyper-local meteorological forecasting with logistics data to reroute high-value shipments before disruption event windows.
CATEGORY_04The Logic of Intervention
Risk analytics is only valuable when it leads to a definitive action. Our framework guides decision-makers through a factual breakdown of operational choices, ensuring that mitigation efforts are both proportional and effective.
Phase A
Threat Categorization
Threats are first separated into controllable internal factors and exogenous regional variables. This ensures energy is focused on areas where the business has direct operational agency.
Requirement: High-fidelity logistics data from ERP/WMS systems.
Phase B
Impact Simulation
We model the "ripple effect" of a specific failure. If a main hub in Bangkok experiences a 20% slowdown, we trace the delay through every downstream customer and fulfillment center.
Metric: Expected Time to Recovery (TTR).
Phase C
Response Matrix
The final stage provides tiered response options: passive monitoring, active rerouting, or strategic inventory buffering. Decisions are based on potential financial impact versus implementation cost.
Outcome: Prescriptive operational directives.


320+
Critical transit points monitored daily across the Asia-Pacific corridor.
Operational Boundries
Ready to stress-test your logistics architecture?
Connect with our Bangkok-based analysts to discuss how our risk methodology can be tailored to your specific organizational constraints.